Application migration, a critical undertaking in modern IT, necessitates a meticulous approach to ensure optimal performance. This guide delves into the multifaceted aspects of managing application performance after migration, providing a structured framework for achieving a seamless transition and sustained operational efficiency. We will explore the intricacies of pre-migration planning, strategic migration approaches, and post-migration optimization techniques.
The objective is to provide actionable insights and best practices, enabling organizations to minimize downtime, mitigate performance degradation, and maximize the value of their migrated applications. The following sections will meticulously examine the key stages of the migration process, from initial assessment and planning to continuous performance monitoring and improvement. This systematic approach ensures that application performance remains robust and adaptable in the new environment.
Pre-Migration Planning and Assessment
Prior to migrating an application, a meticulous pre-migration planning and assessment phase is crucial for ensuring a successful transition and maintaining optimal performance. This involves a comprehensive understanding of the existing application’s architecture, resource utilization, and performance characteristics. The following sections detail the essential steps and considerations for a robust pre-migration assessment.
Application Component Assessment Checklist
A thorough assessment of application components is paramount for identifying potential bottlenecks and compatibility issues before migration. This checklist provides a structured approach to evaluate each component.
- Application Code: Analyze the source code for performance inefficiencies, such as inefficient algorithms, memory leaks, and excessive database queries. Consider code profiling tools to identify performance hotspots.
- Database: Evaluate the database schema, indexing strategy, query optimization, and connection pooling. Assess the database server’s resource utilization (CPU, memory, disk I/O) and replication setup.
- Application Server: Examine the application server’s configuration, including thread pool size, connection limits, and caching mechanisms. Monitor server resource utilization (CPU, memory) and response times.
- Operating System: Assess the operating system’s resource allocation, kernel parameters, and network configuration. Monitor system-level metrics such as CPU usage, memory consumption, and disk I/O.
- Network: Analyze network latency, bandwidth, and packet loss between application components and users. Use network monitoring tools to identify potential bottlenecks.
- Hardware Resources: Evaluate the hardware resources (CPU, memory, storage) allocated to each component. Ensure sufficient resources are available to handle the application’s workload.
- Caching Mechanisms: Review the effectiveness of caching layers (e.g., in-memory caches, content delivery networks). Assess cache hit ratios and eviction policies.
- Third-Party Integrations: Examine the performance of any third-party integrations, such as APIs, web services, and external databases. Monitor response times and error rates.
- Security Configurations: Review security configurations, including firewalls, intrusion detection systems, and access control lists, to ensure they do not impede performance.
- User Interface (UI): Analyze UI performance metrics, such as page load times, render times, and user interaction responsiveness. Identify and address any UI-related performance issues.
Establishing Performance Baselines
Establishing a baseline of the application’s performance characteristics is fundamental for measuring the impact of the migration. This involves collecting key performance indicators (KPIs) under normal operating conditions.
- Define Key Performance Indicators (KPIs): Identify the critical metrics that reflect application performance, such as response time, throughput, error rates, and resource utilization.
- Choose Monitoring Tools: Select appropriate monitoring tools to collect and analyze performance data. The tools should provide real-time monitoring, historical data analysis, and alerting capabilities.
- Establish a Baseline Period: Define a period during which the application’s performance will be monitored under normal operating conditions. This period should be long enough to capture typical workload patterns.
- Collect Performance Data: Collect data on the defined KPIs throughout the baseline period. Ensure the data is collected at regular intervals and stored for future analysis.
- Analyze Baseline Data: Analyze the collected data to establish a baseline for each KPI. Identify the average, minimum, and maximum values for each metric.
- Document the Baseline: Document the baseline data, including the KPIs, their baseline values, and any observed trends or patterns. This documentation will serve as a reference point for comparing performance before and after migration.
- Simulate Load Tests: Perform load tests to simulate different levels of user traffic and identify the application’s performance under stress. This helps to understand the application’s scalability and identify potential bottlenecks.
Performance Monitoring Tool Comparison
The selection of appropriate performance monitoring tools is crucial for effective pre-migration assessment. The following table compares several popular tools based on their key features.
| Tool | Key Features | Advantages | Disadvantages |
|---|---|---|---|
| Prometheus | Time-series database, data collection via exporters, flexible query language (PromQL), alerting. | Open-source, highly scalable, supports various data sources, excellent for monitoring containerized environments (e.g., Kubernetes). | Can be complex to set up and configure, requires familiarity with PromQL, may require additional tools for advanced visualization. |
| Grafana | Data visualization and dashboarding, supports various data sources (including Prometheus, InfluxDB, and others), alerting, user management. | User-friendly interface, highly customizable dashboards, supports a wide range of data sources, strong community support. | Not a data collection tool itself (relies on external data sources), can be resource-intensive for complex dashboards. |
| New Relic | Application performance monitoring (APM), real-user monitoring (RUM), infrastructure monitoring, error tracking, alerting, AI-powered insights. | Comprehensive platform, easy to set up, provides detailed performance analysis, excellent for troubleshooting. | Commercial tool (paid subscription), can be expensive for large-scale deployments, data retention limits. |
| Dynatrace | AI-powered APM, infrastructure monitoring, digital experience monitoring, automation, cloud-native support. | Automated root cause analysis, easy to use, provides deep insights into application performance, excellent for cloud environments. | Commercial tool (paid subscription), can be expensive, requires agent installation on monitored hosts. |
Choosing the Right Migration Strategy
Selecting the optimal migration strategy is crucial for maintaining and potentially improving application performance post-migration. The chosen approach directly impacts the application’s operational efficiency, scalability, and resilience. A poorly chosen strategy can lead to performance degradation, increased costs, and operational complexities. The selection process must be informed by a thorough understanding of the application’s architecture, dependencies, and business requirements.
Impact of Migration Approaches on Application Performance
Different migration strategies exert varying influences on application performance. The primary goal is to minimize disruption and optimize performance metrics, such as response time, throughput, and resource utilization. The choice of strategy dictates the level of architectural changes and the potential for performance enhancements or regressions.
Lift and Shift Strategy: Pros and Cons
Lift and shift, also known as rehosting, involves migrating an application to a new infrastructure with minimal code changes. This strategy typically focuses on moving the application’s existing components, such as virtual machines or containers, to a cloud environment.
- Pros:
- Speed of Migration: Lift and shift is generally the fastest migration approach. The existing application structure remains largely unchanged, accelerating the migration process.
- Reduced Initial Costs: Since the application is essentially moved as is, there is minimal upfront investment in code refactoring or architectural redesign.
- Familiarity: The existing application’s operational procedures and tools can often be reused, reducing the learning curve for operations teams.
- Reduced Risk: Because code modifications are minimized, the risk of introducing new bugs or performance issues is relatively low.
- Cons:
- Limited Performance Optimization: The application’s performance characteristics are often not significantly improved, and may even degrade, as the underlying architecture is unchanged.
- Potential for Increased Costs: While the initial migration cost is lower, the application might not be optimized for the new cloud environment, potentially leading to higher operational costs due to inefficient resource utilization.
- Lack of Cloud-Native Benefits: The application does not leverage cloud-native services, such as auto-scaling, serverless computing, and managed databases, which can significantly improve performance and reduce operational overhead.
- Vendor Lock-in: Migrating without architectural changes may increase the likelihood of vendor lock-in, as the application may be tightly coupled to specific cloud provider services.
Re-platform Strategy: Pros and Cons
Re-platforming, also known as “lift, tinker, and shift,” involves migrating an application to a new platform with some code modifications to leverage cloud-native services. This approach strikes a balance between minimal changes and performance improvements.
- Pros:
- Performance Improvements: By leveraging cloud-native services like managed databases or container orchestration, performance can be improved, especially in areas like scalability and resilience.
- Cost Optimization: Utilizing platform-specific services can often lead to cost savings by reducing the need for manual management and optimizing resource utilization.
- Increased Scalability: The application can benefit from the scalability features of the new platform, allowing it to handle increased workloads more effectively.
- Reduced Operational Overhead: Using managed services can reduce the operational burden, freeing up resources for other tasks.
- Cons:
- Moderate Complexity: Re-platforming involves some code modifications, increasing the complexity of the migration process compared to lift and shift.
- Moderate Risk: While the risk is lower than re-architecting, introducing new services or code changes can still introduce potential performance issues or bugs.
- Dependency on Platform: The application becomes more dependent on the new platform’s services, which can lead to vendor lock-in.
- Potential for Downtime: The migration process may require some downtime, depending on the application’s architecture and the extent of the changes.
Re-architect Strategy: Pros and Cons
Re-architecting involves redesigning the application to take full advantage of cloud-native features and services. This strategy typically involves significant code changes and a complete architectural overhaul.
- Pros:
- Significant Performance Improvements: Re-architecting enables the application to be optimized for performance, scalability, and resilience by leveraging cloud-native services such as serverless functions, microservices, and container orchestration.
- Cost Efficiency: The application can be designed to utilize resources more efficiently, leading to cost savings through features like auto-scaling and pay-as-you-go pricing.
- Enhanced Scalability and Agility: The application becomes highly scalable and adaptable to changing business requirements.
- Reduced Operational Overhead: Cloud-native services can automate many operational tasks, reducing the burden on operations teams.
- Cons:
- High Complexity: Re-architecting is the most complex migration approach, requiring significant time, resources, and expertise.
- High Initial Costs: The upfront costs of re-architecting, including development and testing, can be substantial.
- High Risk: The extensive code changes and architectural redesign can introduce new bugs and performance issues, increasing the risk of migration failure.
- Longer Time to Market: The migration process can take a considerable amount of time, delaying the benefits of the new architecture.
Factors to Consider When Selecting a Migration Strategy
Selecting the optimal migration strategy requires a careful assessment of several factors to align the chosen approach with the application’s characteristics and business goals. The decision should be data-driven and based on a comprehensive understanding of the application’s current state and future requirements.
- Application Architecture: The application’s architecture is a primary consideration. Monolithic applications may be better suited for lift and shift or re-platforming, while microservices-based applications are ideal candidates for re-architecting.
- Business Requirements: The business’s goals for the migration, such as cost reduction, improved scalability, or faster time to market, significantly influence the choice of strategy.
- Performance Requirements: The desired performance characteristics, including response time, throughput, and resource utilization, dictate the level of architectural changes required.
- Budget and Timeline: The available budget and the desired migration timeline are critical constraints. Lift and shift is typically the fastest and least expensive approach, while re-architecting is the most time-consuming and costly.
- Skills and Expertise: The availability of internal skills and expertise, or the ability to acquire them, influences the complexity of the migration. Re-architecting requires specialized skills in cloud-native technologies.
- Risk Tolerance: The organization’s risk tolerance impacts the choice of strategy. Lift and shift carries the lowest risk, while re-architecting carries the highest.
- Existing Infrastructure: The current infrastructure, including servers, databases, and networking, must be assessed to determine the feasibility of different migration approaches.
- Dependencies: Identifying and understanding application dependencies, including external services and libraries, is essential for planning the migration and minimizing disruptions.
Data Migration Best Practices
Data migration is a critical component of any application migration, demanding meticulous planning and execution to ensure a seamless transition. The process involves moving data from one storage system, application, or environment to another, necessitating strategies to minimize downtime, data loss, and maintain data integrity. This section focuses on best practices to achieve these goals.
Procedures for Efficient Data Migration and Minimizing Downtime
Efficient data migration hinges on a well-defined strategy that considers data volume, complexity, and business requirements. The objective is to reduce downtime, a critical factor for business continuity. This can be achieved by employing a phased approach, data validation, and utilizing the right tools.
- Pre-migration Planning and Preparation: This initial phase involves a comprehensive understanding of the source and target environments. Analyze data structures, dependencies, and volumes to estimate migration timelines. This includes data profiling to identify potential data quality issues that need addressing before migration. Thorough planning minimizes unexpected issues during the migration process.
- Choosing the Right Migration Strategy: Selecting the optimal strategy is crucial. Consider the following approaches:
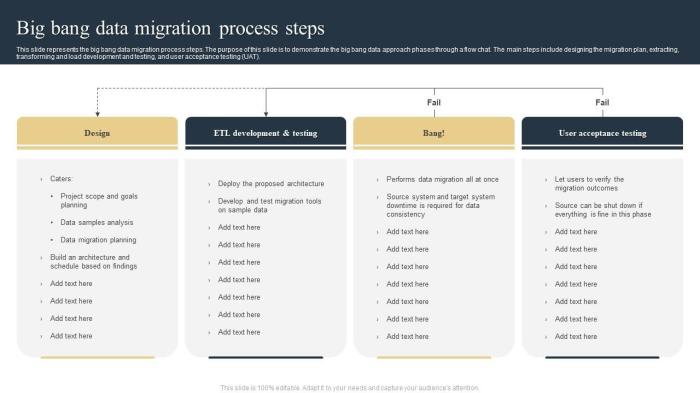
- Big Bang Migration: All data is migrated at once. This method is suitable for smaller datasets or when downtime is less critical. However, it carries a higher risk of data loss or prolonged downtime if issues arise.
- Trickle Migration: Data is migrated in stages, allowing for continuous data availability. This minimizes downtime and allows for iterative testing.
- Hybrid Migration: Combines elements of both big bang and trickle approaches, providing flexibility based on data types and priorities.
- Data Extraction, Transformation, and Loading (ETL): The ETL process is the core of data migration. Extract data from the source, transform it to fit the target environment’s schema, and load it into the new system.
The ETL process typically follows these steps: Extract -> Transform -> Load.
Data transformation may involve data cleansing, data type conversion, and schema mapping. Efficient ETL processes significantly reduce migration time.
- Data Migration Execution: Implement the chosen migration strategy. During this stage, monitor the process closely. Track progress, address errors promptly, and ensure data consistency. Consider the use of parallel processing where possible to expedite the migration.
- Downtime Management: Downtime is inevitable during a migration. Minimize it by scheduling the migration during off-peak hours or implementing techniques such as:
- Zero Downtime Migration: Employing techniques like database replication and continuous synchronization.
- Reducing Downtime: Planning for quick rollback procedures in case of failure.
- Post-Migration Optimization: Once the data is migrated, optimize the new system for performance and scalability. This may involve indexing, query optimization, and storage configuration.
Methods to Validate Data Integrity Post-Migration
Data integrity verification is essential to ensure data accuracy and consistency after migration. This validation process involves comparing data between the source and target systems to identify discrepancies. Several methods and tools are used to validate the integrity of migrated data.
- Data Comparison: Comparing data records between the source and target systems. This can be done using various techniques:
- Row-by-Row Comparison: Useful for verifying small datasets.
- Checksum Verification: Calculate checksums for data files and compare them.
- Sampling and Statistical Analysis: Analyze samples of data and use statistical methods to assess data accuracy.
- Data Profiling: Create data profiles of the migrated data to verify data types, data ranges, and null values. This helps to identify data quality issues that may have been introduced during the migration.
- Testing and Validation:
- Unit Testing: Validate individual data elements.
- Integration Testing: Test data flows between different components.
- User Acceptance Testing (UAT): Involve end-users to validate data accuracy and usability.
- Automated Validation Tools: Employ specialized data validation tools that automate data comparison and integrity checks. These tools can identify and report discrepancies.
- Reconciliation Reporting: Generate detailed reports that compare the data in the source and target systems. These reports highlight any discrepancies, allowing for timely remediation.
- Auditing and Logging: Implement comprehensive auditing and logging mechanisms to track data changes during and after migration. This provides an audit trail for data integrity.
Data Migration Tools and Their Capabilities
Choosing the right data migration tool is critical for a successful migration. The tools available vary in their features, capabilities, and cost. Selecting the appropriate tool depends on factors such as the data volume, complexity, and the target environment. The table below Artikels some common data migration tools and their respective capabilities.
| Tool | Capabilities | Target Environments | Key Features |
|---|---|---|---|
| AWS Database Migration Service (DMS) | Supports heterogeneous migrations, minimizes downtime, and offers continuous data replication. | AWS cloud services (e.g., RDS, DynamoDB, Redshift), on-premises databases. | Automated schema conversion, real-time data replication, and support for various database engines. |
| Azure Database Migration Service (DMS) | Supports a wide range of database migrations to Azure, including online and offline migrations. | Azure SQL Database, Azure SQL Managed Instance, Azure Database for PostgreSQL, and on-premises databases. | Database assessment, schema conversion, and continuous data replication. |
| Informatica PowerCenter | Offers a comprehensive ETL platform for data integration and migration, supporting complex data transformations. | Various on-premises and cloud-based databases and data warehouses. | Data profiling, data quality, and advanced transformation capabilities. |
| Talend Data Integration | Provides open-source and commercial solutions for data integration and migration, supporting various data sources and targets. | On-premises and cloud-based databases, data warehouses, and big data platforms. | Data profiling, data quality, and a visual development environment. |
Post-Migration Performance Testing
Following a successful application migration, comprehensive performance testing is crucial to validate the migrated application’s functionality, stability, and efficiency. This phase ensures the application behaves as expected in the new environment, meeting or exceeding pre-migration performance benchmarks. Thorough testing minimizes the risk of performance degradation, user dissatisfaction, and potential business disruptions.
Importance of Comprehensive Performance Testing
Post-migration performance testing serves as a critical checkpoint to identify and address potential bottlenecks or performance issues introduced during the migration process. It verifies the application’s ability to handle expected workloads, ensuring that the user experience remains consistent and that business operations are not negatively impacted. This rigorous testing phase allows for proactive optimization, preventing performance-related incidents that could affect productivity and revenue.
Testing also helps to validate the effectiveness of the migration strategy and the accuracy of any configuration changes. The goal is to ensure a seamless transition with no reduction in performance or, ideally, an improvement.
Performance Tests to Conduct
A robust post-migration performance testing strategy incorporates various test types to evaluate different aspects of the application’s behavior under varying conditions. These tests simulate real-world usage scenarios and identify potential vulnerabilities.
- Load Testing: This test assesses the application’s performance under a specific, sustained load. It simulates a defined number of concurrent users accessing the application and measures response times, throughput, and resource utilization. This reveals how the application performs under normal operating conditions and identifies potential performance limitations. For example, if a migrated e-commerce platform experiences a sudden surge in traffic during a promotional period, load testing can predict how the system will handle the increased volume of requests and prevent potential service disruptions.
- Stress Testing: Stress testing pushes the application beyond its normal operating limits to determine its breaking point and how it recovers. This involves gradually increasing the load until the application fails or performance degrades significantly. This test helps identify the maximum capacity of the application and assess its stability under extreme conditions. The objective is to evaluate the application’s resilience and its ability to gracefully handle unexpected spikes in user traffic or resource demands.
For instance, stress testing could simulate a large-scale denial-of-service attack to evaluate the application’s defensive capabilities.
- Endurance Testing (Soak Testing): Endurance testing evaluates the application’s performance over an extended period under a sustained load. It monitors resource consumption, memory leaks, and overall stability over time. This test identifies potential issues that may not surface during shorter-duration tests. This is crucial for identifying issues such as memory leaks or gradual performance degradation that might occur during prolonged use. Consider a long-running financial application; endurance testing can identify potential degradation in transaction processing speed over several hours or days of continuous operation.
- Spike Testing: Spike testing simulates sudden, significant increases in user traffic or workload. It assesses the application’s ability to handle unexpected bursts of activity. This helps determine how the application recovers from a spike and whether it can maintain acceptable performance levels. This test is especially relevant for applications that experience unpredictable traffic patterns, such as news websites or social media platforms during major events.
- Scalability Testing: Scalability testing evaluates the application’s ability to handle increasing workloads by scaling resources. It assesses how the application performs as resources (e.g., servers, databases) are added or removed. This ensures the application can accommodate future growth and user demand. For example, scalability testing can verify how well a migrated cloud-based application performs when additional virtual machines are provisioned to handle increased user load.
Performance Testing Tools
Selecting the right performance testing tools is essential for effectively evaluating application performance. Various tools offer different features and capabilities to meet specific testing requirements.
- Apache JMeter: This open-source tool is widely used for load and performance testing. It supports various protocols, including HTTP, HTTPS, FTP, and database connections.
- Features: Supports load testing, performance testing, and functional testing; offers a user-friendly graphical interface; allows for the creation of test plans with various elements (e.g., threads, samplers, listeners); supports distributed testing; provides extensive reporting capabilities.
- LoadRunner (Micro Focus): This commercial tool is a comprehensive performance testing solution. It supports a wide range of protocols and technologies.
- Features: Offers robust load testing capabilities; supports various testing types, including load, stress, and endurance testing; provides detailed performance analysis and reporting; integrates with various monitoring tools; supports real-user emulation.
- Gatling: This open-source load testing tool is designed for performance testing web applications. It uses a Scala-based domain-specific language (DSL) for test script creation.
- Features: Uses a DSL for creating test scripts; supports HTTP/HTTPS protocols; provides real-time performance monitoring; generates detailed reports; focuses on high performance and scalability.
- BlazeMeter: This cloud-based performance and load testing platform is built on Apache JMeter. It offers a user-friendly interface and supports a wide range of integrations.
- Features: Cloud-based platform for load and performance testing; offers integration with CI/CD pipelines; provides detailed reports and analytics; supports various testing types; offers scalability and ease of use.
- Dynatrace: This is a comprehensive application performance monitoring (APM) platform that provides performance testing capabilities.
- Features: Full-stack monitoring and analysis; real-user monitoring; synthetic monitoring; AI-powered analysis and root cause identification; automated performance testing.
Monitoring and Observability Strategies
Effective monitoring and observability are crucial for ensuring optimal application performance post-migration. These strategies provide the necessary insights to proactively identify and resolve performance bottlenecks, maintain system stability, and ultimately, enhance the user experience. By implementing these techniques, organizations can gain a comprehensive understanding of their migrated application’s behavior and ensure a smooth transition.
Setting Up Real-Time Monitoring Dashboards
Establishing real-time monitoring dashboards is essential for visualizing application performance metrics and identifying anomalies. These dashboards provide a centralized view of critical performance indicators, allowing for quick detection of issues and proactive intervention.To create effective real-time monitoring dashboards, several considerations are paramount:
- Metric Selection: Carefully select the most relevant metrics that accurately reflect application performance. These metrics should align with the specific goals and objectives of the application.
- Dashboard Design: Design dashboards that are intuitive and easy to understand. Use clear visualizations, such as graphs and charts, to represent data effectively. Consider the target audience and their specific needs when designing the dashboard.
- Data Aggregation and Visualization: Implement efficient data aggregation and visualization techniques to handle large volumes of data. Use appropriate chart types to display data trends and patterns.
- Alerting and Notification: Configure alerts based on predefined thresholds to notify relevant teams of potential issues. Integrate notification systems to ensure timely communication of critical events.
- Dashboard Customization: Allow for customization of dashboards to meet specific needs. Enable users to create their own views and customize the display of metrics.
For example, consider a scenario where a retail application has been migrated to a cloud environment. A well-designed dashboard might include real-time visualizations of:
- Transaction Rate: Transactions per second (TPS) to monitor the application’s ability to handle user requests.
- Response Time: Average response time for key API calls to assess user experience.
- Error Rate: Percentage of failed requests to identify potential bugs or system failures.
- Resource Utilization: CPU, memory, and disk utilization of application servers to ensure adequate capacity.
These metrics, displayed in real-time, enable the operations team to quickly identify a sudden spike in error rates or a decrease in transaction throughput, enabling immediate investigation and mitigation. The dashboard might use a combination of line graphs to show trends over time, bar charts to compare performance across different servers, and gauges to represent current utilization levels. Color-coding and threshold-based alerts further enhance the dashboard’s ability to highlight critical issues.
Using Observability Tools to Troubleshoot Performance Issues
Observability tools provide the means to understand the internal state of a system, enabling efficient troubleshooting of performance issues. These tools go beyond simple monitoring by providing detailed insights into the application’s behavior, including tracing, logging, and metrics.Observability tools facilitate troubleshooting through several key capabilities:
- Distributed Tracing: Track the flow of requests across distributed systems, identifying performance bottlenecks in specific services or components.
- Detailed Logging: Capture comprehensive logs that provide context around events, including errors, warnings, and informational messages.
- Metric Aggregation: Collect and aggregate metrics from various sources to identify trends and patterns.
- Correlation and Analysis: Correlate data from different sources to identify root causes of performance issues.
Consider a scenario where a migrated e-commerce application experiences slow checkout times. Observability tools can be employed to pinpoint the source of the problem:
- Tracing: Using distributed tracing, the operations team can trace a checkout request as it passes through different microservices (e.g., product catalog, shopping cart, payment processing). The trace data might reveal that the payment processing service is taking an unusually long time to respond.
- Logging: Detailed logs from the payment processing service can be examined to understand the cause of the delay. The logs might reveal a database query that is inefficient or a dependency on an external service that is experiencing latency.
- Metrics: Metric aggregation can reveal that the number of database queries is significantly higher during checkout than during other parts of the user journey, which might suggest that the query is not optimized.
Through the combined use of tracing, logging, and metrics, the team can quickly identify the root cause of the slow checkout times, enabling them to focus their efforts on optimizing the payment processing service or database query.
Key Metrics to Monitor After Migration
Monitoring a comprehensive set of metrics is crucial for assessing application performance post-migration. These metrics provide insights into various aspects of the application, from resource utilization to user experience.
- Response Time: Measures the time it takes for the application to respond to user requests. This is a key indicator of user experience.
- Transaction Rate: Represents the number of transactions processed per second or minute. It reflects the application’s throughput.
- Error Rate: Indicates the percentage of failed requests. High error rates signal potential problems with the application or its infrastructure.
- CPU Utilization: Monitors the CPU usage of application servers. High CPU utilization can indicate a performance bottleneck.
- Memory Utilization: Tracks the memory usage of application servers. Excessive memory usage can lead to performance degradation.
- Disk I/O: Measures the input/output operations per second (IOPS) of the storage system. High disk I/O can indicate a storage bottleneck.
- Network Latency: Measures the time it takes for data to travel between the application and its users or other services. High network latency can impact performance.
- Database Query Performance: Monitors the performance of database queries, including execution time and query volume. Slow queries can significantly impact application performance.
- User Experience Metrics: Measures user-centric metrics, such as page load time, first contentful paint (FCP), and time to interactive (TTI). These metrics provide insights into the perceived performance of the application.
Resource Optimization in the New Environment
Migrating an application is not merely a shift of code and data; it’s an opportunity to re-evaluate and optimize resource utilization. The new environment, whether it’s a cloud platform or a different on-premises setup, presents opportunities to fine-tune resource allocation, reduce costs, and enhance application performance. This section focuses on strategies for achieving these goals, covering methods for optimizing resource allocation and scaling the application effectively.
Methods for Optimizing Resource Allocation
Optimizing resource allocation is critical for ensuring efficient and cost-effective application performance. This involves carefully considering the CPU, memory, and storage requirements of the application and then allocating resources accordingly. Several strategies can be employed to achieve this goal.
- Right-Sizing Instances: Selecting the appropriate instance size (CPU, memory) is crucial. Over-provisioning leads to wasted resources and increased costs, while under-provisioning can cause performance bottlenecks. Regularly monitor resource utilization metrics (CPU utilization, memory usage, disk I/O) to identify the optimal instance size. For example, a web server consistently utilizing only 20% of its CPU capacity might be a candidate for down-sizing.
- Automated Scaling: Implementing auto-scaling allows the application to dynamically adjust its resources based on demand. This ensures that the application has sufficient resources during peak loads and reduces costs during periods of low activity. Cloud providers offer auto-scaling features that can be configured based on various metrics, such as CPU utilization, network traffic, or custom metrics.
- Resource Pooling and Sharing: Utilizing resource pooling and sharing mechanisms, such as containerization (e.g., Docker, Kubernetes), can improve resource utilization. Containers allow multiple applications to share the same underlying infrastructure, maximizing resource efficiency. This is particularly beneficial for applications with fluctuating resource demands.
- Storage Optimization: Choosing the right storage type and optimizing storage configurations are essential. Consider factors such as storage performance, capacity, and cost. For example, using SSDs (Solid State Drives) for frequently accessed data can significantly improve read/write performance. Object storage can be cost-effective for storing large amounts of infrequently accessed data.
- Caching: Implementing caching mechanisms at various levels (e.g., browser caching, CDN caching, server-side caching) can reduce the load on servers and improve response times. Caching stores frequently accessed data closer to the user, minimizing the need to retrieve it from the origin server.
Techniques for Scaling the Application to Handle Increased Load
Scaling an application to handle increased load is essential for maintaining performance and availability during peak traffic periods. Various techniques can be employed to achieve this, ranging from horizontal scaling to architectural adjustments.
- Horizontal Scaling (Scaling Out): This involves adding more instances of the application to distribute the load. This is a common and effective approach for handling increased traffic. Cloud platforms make it easy to scale horizontally using auto-scaling groups. The key is to ensure the application is designed to be stateless or that state is managed separately (e.g., using a database or caching layer).
- Vertical Scaling (Scaling Up): This involves increasing the resources (CPU, memory) of a single instance. While simpler to implement than horizontal scaling, vertical scaling has limitations, as there is a maximum amount of resources that can be added to a single instance.
- Load Balancing: Load balancers distribute incoming traffic across multiple instances of the application. This ensures that no single instance is overwhelmed and improves overall application performance and availability. Load balancers also provide health checks to automatically remove unhealthy instances from the pool.
- Database Optimization: Optimizing the database is crucial for scaling. This includes techniques such as database indexing, query optimization, and database sharding (splitting the database across multiple servers). Consider using read replicas to offload read traffic from the primary database.
- Content Delivery Network (CDN): Using a CDN caches static content (images, videos, CSS, JavaScript) closer to users, reducing latency and improving response times. This can significantly reduce the load on the origin servers.
- Asynchronous Processing: Implementing asynchronous processing using message queues (e.g., RabbitMQ, Kafka) can offload time-consuming tasks from the main application thread, improving responsiveness and scalability. For example, sending emails or processing image uploads can be handled asynchronously.
Comparison of Cloud Provider Resource Optimization Services
Different cloud providers offer various services for optimizing resource allocation and scaling. The following table provides a comparison of some key services offered by Amazon Web Services (AWS), Microsoft Azure, and Google Cloud Platform (GCP).
| Feature | AWS | Azure | GCP |
|---|---|---|---|
| Compute Instance Sizing | EC2 Instance Types (wide range, optimized for various workloads) | Virtual Machines (various sizes and families, including specialized VMs) | Compute Engine Machine Types (flexible and pre-defined options) |
| Auto-Scaling | EC2 Auto Scaling (based on various metrics and policies) | Virtual Machine Scale Sets (supports auto-scaling based on CPU, memory, etc.) | Compute Engine Auto Scaling (based on CPU utilization, load balancing, etc.) |
| Load Balancing | Elastic Load Balancing (ELB)
| Azure Load Balancer, Application Gateway | Cloud Load Balancing (global and regional options) |
| Caching | Amazon CloudFront (CDN), ElastiCache (in-memory caching) | Azure CDN, Azure Cache for Redis | Cloud CDN, Memorystore (in-memory caching) |
Database Performance Tuning
Database performance tuning is a critical activity following a migration, as the new environment may introduce performance bottlenecks not present in the original system. This involves systematically identifying and addressing performance issues within the database to ensure optimal query execution speed, efficient resource utilization, and overall application responsiveness.
Tuning efforts must be iterative, requiring careful monitoring, analysis, and adjustment.
Steps to Tune Database Performance After Migration
The process of tuning a database post-migration involves several key steps. Each step is crucial for achieving and maintaining optimal database performance.
- Baseline Establishment: Establishing a performance baseline before making any changes is essential. This involves collecting performance metrics such as query execution times, CPU utilization, memory usage, disk I/O, and network latency. These metrics serve as a reference point for evaluating the effectiveness of subsequent tuning efforts. This baseline should be created under normal load conditions, representative of the expected application usage.
- Performance Monitoring and Profiling: Continuous monitoring of database performance is necessary to identify areas needing attention. Database monitoring tools, such as those offered by the database vendor (e.g., Oracle Enterprise Manager, SQL Server Management Studio, PostgreSQL’s `pg_stat_statements`), can provide valuable insights into query performance, resource consumption, and potential bottlenecks. Profiling tools help pinpoint slow-running queries and identify their execution plans.
- Query Analysis and Optimization: Analyze slow-running queries identified through monitoring and profiling. Examination of query execution plans is critical to understanding how the database processes queries. Indexing strategies, query rewriting, and the use of appropriate data types are important optimization techniques.
- Index Optimization: Indexing significantly impacts query performance. Review and optimize existing indexes, and create new indexes as needed to support frequently executed queries, particularly those involving `WHERE` clauses, `JOIN` operations, and `ORDER BY` clauses. Ensure indexes are appropriate for the query patterns and are not overly indexed, which can degrade performance during write operations.
- Database Configuration Tuning: Adjust database configuration parameters to optimize resource allocation. This may include memory allocation (e.g., buffer cache size), connection limits, and the number of background processes. These settings should be adjusted based on the hardware resources available and the workload characteristics.
- Hardware Resource Assessment: Evaluate the underlying hardware resources, including CPU, memory, storage, and network. Insufficient resources can lead to performance bottlenecks. Consider upgrading hardware or scaling the database environment to meet performance requirements.
- Testing and Iteration: Implement changes in a controlled environment and thoroughly test them before applying them to the production system. Continuously monitor performance after each change and iterate on the tuning process to achieve optimal results.
Impact of Database Schema Changes on Performance
Database schema changes can significantly impact database performance. Modifications to table structures, data types, and relationships can either improve or degrade query execution speed and resource utilization. Careful planning and testing are essential when making schema changes.
Schema changes can influence database performance in several ways:
- Index Impact: Altering table schemas, such as adding or removing columns, can invalidate existing indexes, requiring them to be rebuilt. Adding indexes can improve query performance, while removing unnecessary indexes can reduce storage overhead and improve write performance.
- Data Type Optimization: Selecting the appropriate data types for columns is critical. Using the smallest possible data type for a given column can reduce storage space and improve query performance. For example, using `INT` instead of `BIGINT` when the values will never exceed the `INT` range.
- Relationship and Constraint Effects: Changes to relationships between tables, such as adding or removing foreign keys, can affect the performance of `JOIN` operations and data integrity checks. Properly defined constraints can also help the query optimizer generate more efficient execution plans.
- Table Structure Changes: Modifications to table structure, such as adding or removing columns, can necessitate the rewriting of existing queries. This can impact query performance if the queries are not optimized for the new structure.
- Data Volume Considerations: Schema changes may need to be considered in the context of the data volume. As data volumes grow, the impact of schema changes on performance can become more pronounced.
Database Query Optimization Techniques
Query optimization is a core aspect of database performance tuning. The following are some common query optimization techniques.
- Indexing: Creating indexes on frequently queried columns to speed up data retrieval. For example, consider a table named `Customers` with a `CustomerID` column. Creating an index on `CustomerID` will significantly speed up queries like `SELECT
– FROM Customers WHERE CustomerID = 123;`.- Query Rewriting: Rewriting queries to improve their efficiency. For example, replacing a subquery with a `JOIN` operation can often improve performance.
- Using Appropriate Data Types: Selecting the most appropriate data types for columns to minimize storage space and improve query performance. For example, use `INT` instead of `VARCHAR` for storing numerical data.
- Avoiding `SELECT
-`: Specifying only the necessary columns in `SELECT` statements to reduce the amount of data retrieved.- Optimizing `JOIN` Operations: Ensuring that `JOIN` operations are efficient, for instance, by using the correct `JOIN` types and ensuring that the columns used in the `JOIN` conditions are indexed.
- Using `WHERE` Clauses Effectively: Using `WHERE` clauses to filter data as early as possible in the query execution plan to reduce the amount of data processed.
- Optimizing Aggregation: Using aggregate functions (e.g., `COUNT`, `SUM`, `AVG`) efficiently and ensuring that the columns used in the `GROUP BY` clause are indexed.
- Prepared Statements: Using prepared statements to reduce parsing overhead and improve query performance, especially for frequently executed queries.
Application Code Optimization

Application code optimization is a critical step in maximizing performance after migration. The new environment, whether it’s a cloud platform, a new infrastructure, or a different technology stack, can expose performance bottlenecks that were previously hidden. Optimizing the application code ensures it leverages the resources of the new environment effectively, leading to improved response times, reduced resource consumption, and a better user experience.
This process involves identifying and rectifying inefficiencies in the code that impede performance.
Strategies for Optimizing Application Code for the New Environment
Optimizing application code for a new environment necessitates a multifaceted approach. This includes understanding the architecture of the new environment, profiling the application to identify bottlenecks, and applying specific optimization techniques. These strategies should be applied iteratively, with each change followed by performance testing to measure the impact.* Environment Awareness: The code should be aware of the environment it’s running in.
For example, if migrating to a cloud environment, the code should leverage cloud-specific services such as caching, load balancing, and auto-scaling.
Profiling and Bottleneck Identification
Utilize profiling tools to pinpoint performance bottlenecks. These tools analyze code execution and identify areas where the application spends the most time.
Code Refactoring
Refactor inefficient code segments. This involves restructuring code to improve readability, maintainability, and performance. Consider applying design patterns to address common performance issues.
Algorithm Optimization
Review and optimize algorithms. Choose the most efficient algorithms for specific tasks. Consider the time and space complexity of algorithms.
Data Structure Optimization
Select appropriate data structures for storing and accessing data. The choice of data structure can significantly impact performance.
Caching Implementation
Implement caching strategies to reduce database load and improve response times. Cache frequently accessed data in memory or at the edge.
Concurrency and Parallelism
Leverage concurrency and parallelism to improve application throughput, particularly in multi-core environments. Utilize threads, processes, or asynchronous operations to perform tasks concurrently.
Resource Management
Optimize resource usage, including memory allocation, file I/O, and network connections. Avoid memory leaks and inefficient resource allocation.
Database Query Optimization
Optimize database queries to reduce database load and improve query response times. Use indexing, query rewriting, and connection pooling.
Code Minification and Bundling
For web applications, minify and bundle JavaScript and CSS files to reduce file sizes and improve loading times.
Examples of Code Optimization Techniques
Specific code optimization techniques depend on the application’s programming language and architecture. These techniques, when applied strategically, can significantly improve performance.* Lazy Loading: Implement lazy loading for images and other resources to defer their loading until they are needed. This improves initial page load times. For instance, in a web application, instead of loading all images at once, only load the images that are currently visible in the viewport.* Database Query Optimization: Optimize SQL queries to reduce execution time.
For example, ensure that appropriate indexes are used on database tables to speed up data retrieval. A query like `SELECT
FROM users WHERE username = ‘johndoe’` would benefit significantly from an index on the `username` column.
* Caching Frequently Accessed Data: Implement caching mechanisms to store frequently accessed data in memory or at the edge. For example, cache the results of expensive database queries or API calls. This reduces the load on the database and improves response times.* Algorithm Optimization: Choose the most efficient algorithm for a specific task. For instance, when searching a sorted array, use binary search instead of a linear search.
Binary search has a time complexity of O(log n), while linear search has a time complexity of O(n).* Code Profiling and Bottleneck Identification: Use profiling tools to identify performance bottlenecks. For example, use a profiler to identify slow-running functions or memory leaks. This information can be used to focus optimization efforts.* Asynchronous Operations: Utilize asynchronous operations to avoid blocking the main thread.
For instance, perform I/O operations or network requests asynchronously to prevent the application from freezing. This can be especially beneficial in web applications, allowing the user interface to remain responsive while data is being fetched.* Code Minification: Reduce the size of JavaScript and CSS files to improve loading times. This involves removing unnecessary characters, such as whitespace and comments, and shortening variable names.
Code Profiling Tools and Their Functionalities
Code profiling tools provide valuable insights into an application’s performance, identifying areas for optimization. These tools vary in their features and capabilities, catering to different programming languages and platforms.* Java Profilers (e.g., JProfiler, YourKit Java Profiler):
Functionality
Analyze CPU usage, memory allocation, thread activity, and garbage collection. Provide detailed call graphs and flame graphs to visualize performance bottlenecks.
Use Case
Identifying performance issues in Java applications, such as slow methods, memory leaks, and excessive object creation.* Python Profilers (e.g., cProfile, Py-Spy):
Functionality
Measure the execution time of functions and identify the most time-consuming parts of the code. cProfile is a built-in profiler, while Py-Spy offers more advanced features, like sampling and real-time profiling.
Use Case
Optimizing Python scripts and identifying performance bottlenecks, such as slow function calls or inefficient algorithms.* .NET Profilers (e.g., PerfView, dotTrace):
Functionality
Analyze CPU usage, memory allocation, and thread activity in .NET applications. PerfView is a free tool from Microsoft, while dotTrace offers more advanced features, like memory leak detection.
Use Case
Identifying performance issues in .NET applications, such as slow methods, memory leaks, and excessive object creation.* Go Profilers (e.g., pprof):
Functionality
Built-in profiling tools for Go applications. Analyze CPU usage, memory allocation, goroutine activity, and mutex contention.
Use Case
Identifying performance issues in Go applications, such as CPU-intensive functions, memory leaks, and inefficient concurrency patterns.* JavaScript Profilers (e.g., Chrome DevTools, Firefox Developer Tools):
Functionality
Analyze CPU usage, memory allocation, and network activity in web applications. Provide detailed timelines and flame graphs to visualize performance bottlenecks.
Use Case
Identifying performance issues in web applications, such as slow JavaScript execution, memory leaks, and inefficient network requests.* Database Profilers (e.g., SQL Server Profiler, pgAdmin):
Functionality
Monitor database query execution and identify slow queries. Provide detailed information about query execution plans and resource usage.
Use Case
Optimizing database queries and identifying performance bottlenecks, such as missing indexes or inefficient query plans.* Application Performance Monitoring (APM) Tools (e.g., New Relic, Datadog):
Functionality
Monitor the performance of entire applications, including CPU usage, memory allocation, database queries, and network requests. Provide dashboards and alerts to visualize performance trends and identify bottlenecks.
Use Case
Monitoring the performance of applications in production and identifying performance issues, such as slow response times or high error rates.
Network Configuration and Optimization
Optimizing network settings is crucial for ensuring optimal application performance after migration. A well-configured network minimizes latency, maximizes bandwidth utilization, and provides a stable foundation for application functionality. Effective network management directly translates to improved user experience and efficient resource utilization in the new environment.
Network Configuration for Improved Application Performance
Proper network configuration involves several key areas, each contributing to the overall performance of migrated applications. These configurations must be tailored to the specific application requirements and the characteristics of the new infrastructure.
- Quality of Service (QoS): Implementing QoS prioritizes network traffic based on application needs. For instance, real-time applications like VoIP or video conferencing can be given higher priority to minimize latency and packet loss. This is achieved by marking packets with specific QoS tags, such as Differentiated Services Code Point (DSCP) values, to instruct network devices on how to handle the traffic.
- Firewall Rules: Configure firewall rules to allow necessary traffic and block unwanted connections. Restrict access based on source IP addresses, ports, and protocols to enhance security and minimize potential attack vectors that could degrade performance. Regular review and updating of firewall rules are essential.
- Network Segmentation: Segment the network into logical zones to isolate applications and services. This can improve security by limiting the blast radius of potential security breaches and can also optimize performance by reducing broadcast traffic within a specific segment.
- DNS Configuration: Optimize DNS settings for faster name resolution. Use authoritative DNS servers with low latency and configure caching mechanisms to reduce the time it takes to translate domain names into IP addresses. This is especially important for applications that rely heavily on external services.
- Load Balancing: Implement load balancing across multiple servers or instances to distribute network traffic and prevent overload on a single server. This improves application availability and performance by ensuring that requests are handled efficiently, even during peak loads.
- TCP/IP Tuning: Adjust TCP/IP parameters, such as window size and buffer sizes, to optimize data transfer rates. For example, increasing the TCP window size can improve throughput for high-bandwidth connections, while tuning buffer sizes can help reduce packet loss.
Impact of Latency and Bandwidth on Application Performance
Latency and bandwidth are fundamental network characteristics that significantly influence application performance. Understanding their impact is essential for effective optimization.
- Latency: Latency refers to the delay in transmitting data over a network, typically measured in milliseconds (ms). High latency can lead to slow response times, sluggish application performance, and a poor user experience.
- Bandwidth: Bandwidth represents the maximum amount of data that can be transmitted over a network connection in a given time, usually measured in bits per second (bps) or megabits per second (Mbps). Insufficient bandwidth can result in bottlenecks, leading to slow data transfer rates and reduced application performance.
The relationship between latency and bandwidth is complex, and their combined effect on application performance depends on the application’s specific requirements. For instance, applications that require real-time interaction, such as online games or video conferencing, are highly sensitive to latency. Even a small increase in latency can significantly degrade the user experience. On the other hand, applications that transfer large files, such as data backups or video streaming, are more sensitive to bandwidth.
Insufficient bandwidth can cause buffering, slow download times, and overall performance degradation.
Consider a simple example: An e-commerce website. If the network has high latency, each click by a user might take a significant time to register, causing frustration and potentially leading the user to abandon the site. However, if the network has high bandwidth, images and videos on the website will load quickly, enhancing the user experience. Conversely, a database application transferring large datasets across the network will be severely affected by insufficient bandwidth, even if the latency is low.
Network Performance Monitoring Tools
Network performance monitoring tools provide valuable insights into network behavior, allowing administrators to identify and resolve performance bottlenecks. Selecting the right tools depends on specific requirements and the complexity of the network environment. The following table compares several network performance monitoring tools, highlighting their key features and functionalities.
| Tool | Key Features | Metrics Monitored | Advantages | Disadvantages |
|---|---|---|---|---|
| Wireshark | Packet analyzer, protocol dissection, real-time capture, offline analysis. | Packet loss, latency, bandwidth utilization, protocol-specific metrics. | Free and open-source, highly versatile, detailed packet-level analysis. | Can be complex to use, requires expertise in network protocols, not ideal for real-time monitoring of large networks. |
| SolarWinds Network Performance Monitor (NPM) | Network device monitoring, bandwidth monitoring, performance alerting, customizable dashboards. | Bandwidth utilization, CPU usage, memory usage, latency, packet loss, interface status. | Comprehensive monitoring capabilities, user-friendly interface, good for large enterprise environments. | Commercial software, can be expensive, requires initial setup and configuration. |
| Nagios Core/XI | Open-source monitoring system, host and service monitoring, alerting, reporting. | Host availability, service status, latency, bandwidth utilization (via plugins). | Highly customizable, flexible, large community support, cost-effective (Core version). | Requires configuration and customization, can be complex to set up initially, interface may appear dated. |
| Zabbix | Open-source monitoring solution, real-time monitoring, historical data storage, alerting, and visualization. | CPU load, memory usage, disk space, network traffic, latency, and more through various templates. | Scalable, supports a wide range of devices and services, good for large and complex environments, comprehensive dashboards. | Can be complex to configure initially, resource-intensive for very large deployments. |
The table above presents a comparison of different network monitoring tools. Wireshark is a powerful, free tool, best suited for detailed packet-level analysis and troubleshooting. SolarWinds NPM is a commercial solution that offers comprehensive monitoring capabilities for large networks. Nagios is a flexible, open-source option, known for its customizability. Zabbix is another open-source tool with a strong emphasis on scalability and visualization, ideal for complex environments.
The choice of tool depends on the specific needs and resources available.
Security Considerations and Performance
Application migration, while aimed at enhancing performance and efficiency, introduces a complex interplay between security measures and the resulting impact on application responsiveness and resource utilization. Striking the optimal balance between robust security protocols and acceptable performance levels is a critical aspect of post-migration management. This section explores the intricate relationship between these two domains, offering insights into strategies for mitigating performance degradation caused by security implementations.
Relationship Between Security Measures and Application Performance
Security measures, designed to protect applications and data from unauthorized access, breaches, and vulnerabilities, inherently consume system resources. The extent of this resource consumption directly influences application performance. Implementing security controls such as encryption, authentication, authorization, and intrusion detection systems (IDS) can introduce overhead in several ways:
- Computational Overhead: Encryption and decryption processes, which are fundamental to data security, demand significant computational power. This can lead to increased CPU utilization, slower response times, and reduced throughput, particularly in applications dealing with large volumes of encrypted data. For instance, Transport Layer Security (TLS/SSL) handshakes, crucial for secure communication, involve computationally intensive cryptographic operations.
- Network Latency: Security protocols often require additional network hops and packet inspection, increasing latency. Firewalls, intrusion prevention systems (IPS), and web application firewalls (WAFs) analyze network traffic to identify and block malicious activity. This inspection process adds delays as each packet is examined, impacting the speed at which data is transmitted and received.
- Storage I/O: Logging and auditing, vital for security monitoring and incident response, generate significant storage I/O activity. Security information and event management (SIEM) systems collect and analyze vast amounts of log data, which can strain storage resources, particularly when dealing with high-volume application traffic.
- Memory Consumption: Security tools and processes, such as antivirus software and security agents, consume system memory. Excessive memory usage can lead to swapping, where the operating system moves data between RAM and disk, significantly slowing down application performance.
Methods to Balance Security and Performance
Achieving a balance between security and performance requires a multi-faceted approach. The goal is to implement robust security measures without unduly impacting application responsiveness. Several strategies can be employed:
- Optimize Security Configurations: Configure security tools and protocols for optimal performance. For example, fine-tune firewall rules to minimize unnecessary packet inspection and enable caching to reduce the frequency of cryptographic operations.
- Hardware Acceleration: Utilize hardware acceleration for computationally intensive security tasks, such as encryption and decryption. Hardware Security Modules (HSMs) can offload cryptographic operations from the CPU, significantly improving performance.
- Strategic Placement of Security Controls: Carefully consider the placement of security controls within the application architecture. For instance, implementing a WAF at the edge of the network can protect the application without impacting the core application servers.
- Implement Caching: Cache frequently accessed data and security-related information to reduce the load on backend systems. For example, caching authentication tokens can minimize the frequency of authentication requests.
- Use Efficient Security Protocols: Choose efficient security protocols and algorithms. For example, select modern encryption algorithms that offer strong security with minimal computational overhead.
- Regular Performance Testing: Continuously monitor and test application performance after implementing security measures. This allows for identifying and addressing performance bottlenecks caused by security configurations.
- Resource Allocation: Allocate sufficient resources (CPU, memory, storage) to accommodate the overhead introduced by security measures. This may involve scaling application infrastructure to handle increased resource demands.
Examples of Security Best Practices That Impact Performance
The following examples illustrate how specific security best practices can affect application performance, highlighting the need for careful planning and optimization:
- Encryption: Implementing strong encryption algorithms, such as AES-256, for data at rest and in transit is crucial for data confidentiality. However, encryption and decryption processes require significant CPU resources. For instance, encrypting a 1GB file using AES-256 on a standard server might take several seconds, depending on the CPU’s processing power. This overhead can become significant in high-volume data processing applications.
- Authentication and Authorization: Robust authentication mechanisms, such as multi-factor authentication (MFA), add layers of security. However, MFA often involves additional steps, such as sending one-time passwords (OTPs) via SMS or generating authentication codes using an authenticator app. These extra steps can introduce latency and slow down the user login process.
- Web Application Firewalls (WAFs): WAFs inspect incoming HTTP traffic to identify and block malicious requests, such as SQL injection attacks and cross-site scripting (XSS) attacks. The inspection process adds latency to each HTTP request, impacting the application’s response time. A WAF can add a delay of 10-50 milliseconds per request, depending on the complexity of the rules and the volume of traffic.
- Intrusion Detection and Prevention Systems (IDPS): IDPS analyze network traffic for suspicious activity. The analysis process, involving deep packet inspection and signature matching, consumes CPU and memory resources. This can impact network throughput, especially during periods of high traffic. A busy IDPS can reduce network throughput by 10-20%.
- Logging and Auditing: Comprehensive logging and auditing, essential for security monitoring and incident response, generate significant storage I/O. Collecting and storing detailed logs from multiple sources, such as servers, applications, and databases, can consume a large amount of disk space and impact storage performance. In a large-scale environment, log storage can consume terabytes of storage per day.
Continuous Performance Improvement
Continuous performance improvement is a crucial aspect of post-migration application management, ensuring sustained optimal performance and resource utilization. It’s an iterative process that involves ongoing monitoring, analysis, and optimization to address performance bottlenecks and adapt to evolving application demands and infrastructure changes. Implementing a robust continuous performance improvement strategy allows organizations to proactively identify and resolve performance issues, leading to improved user experience, reduced operational costs, and enhanced application reliability.
Strategies for Continuous Performance Monitoring and Improvement
Effective continuous performance improvement hinges on a multi-faceted approach, integrating proactive monitoring, rigorous analysis, and iterative optimization cycles. This strategy ensures sustained performance and responsiveness.
- Establishing Baseline Performance Metrics: Before implementing any optimization strategies, it is essential to establish baseline performance metrics. This involves identifying key performance indicators (KPIs) that reflect the application’s performance, such as response times, transaction throughput, error rates, and resource utilization (CPU, memory, disk I/O, network bandwidth). These baselines serve as a reference point for measuring the impact of any changes made during the optimization process.
For example, a baseline might reveal an average page load time of 2 seconds before migration, allowing for comparison post-migration.
- Implementing Comprehensive Monitoring Tools: Deploying a suite of monitoring tools is essential for collecting and analyzing performance data. These tools should provide real-time visibility into the application’s behavior, allowing for the rapid identification of performance issues. Consider using Application Performance Monitoring (APM) tools like Datadog, New Relic, or Dynatrace, which offer features such as distributed tracing, log aggregation, and anomaly detection. Furthermore, system-level monitoring tools like Prometheus and Grafana can be integrated to monitor infrastructure metrics.
- Automating Performance Testing: Automate performance testing as part of the continuous integration and continuous deployment (CI/CD) pipeline. This ensures that every code change is evaluated for its impact on performance before deployment. Use tools like JMeter, Gatling, or Locust to simulate user traffic and measure the application’s performance under load. Integrate these tests into the CI/CD pipeline to catch performance regressions early in the development cycle.
- Regular Performance Reviews and Analysis: Schedule regular performance reviews and analysis sessions. These sessions should involve reviewing the performance data collected by monitoring tools, identifying performance bottlenecks, and formulating optimization strategies. These reviews should include stakeholders from development, operations, and business teams to ensure a holistic understanding of performance issues and their impact.
- Proactive Alerting and Incident Management: Implement a robust alerting system to notify the operations team of any performance degradation or anomalies. Configure alerts based on predefined thresholds for KPIs. Establish a well-defined incident management process to handle performance-related incidents, including rapid investigation, root cause analysis, and resolution. This includes documenting incidents, their causes, and the steps taken to resolve them.
- Iterative Optimization and Refinement: Adopt an iterative approach to performance optimization. Implement changes in small increments, test their impact, and iterate based on the results. This ensures that any performance improvements are measurable and that the application’s performance is continuously refined. For instance, after identifying a database query as a bottleneck, optimize the query, test its performance, and then monitor its impact over time.
Framework for Establishing a Feedback Loop for Performance Optimization
A robust feedback loop is the cornerstone of continuous performance improvement, driving a cycle of observation, analysis, action, and evaluation. This framework enables organizations to proactively address performance issues and continuously refine their applications for optimal performance.
- Monitoring and Data Collection: This initial stage involves the continuous collection of performance data.
- Implementation: Deploy monitoring tools (e.g., APM tools, infrastructure monitoring tools) to gather data on key performance indicators (KPIs) like response times, error rates, resource utilization, and transaction throughput.
- Data Sources: Collect data from various sources, including application servers, databases, network devices, and user-experience monitoring tools.
- Example: Collect data on average page load times, database query execution times, and CPU utilization.
- Analysis Techniques: Utilize data analysis techniques such as trend analysis, correlation analysis, and root cause analysis to pinpoint performance issues.
- Identification: Identify performance bottlenecks, such as slow database queries, inefficient code, or resource contention.
- Example: Analyze response times and identify that a specific database query is consistently slow, contributing to increased page load times.
- Optimization Strategies: Implement optimization strategies such as code refactoring, database query optimization, resource allocation adjustments, and caching.
- Implementation: Implement the chosen optimization strategies in a controlled manner, such as through a staging environment.
- Example: Optimize the slow database query by adding indexes or rewriting the query to improve efficiency.
- Testing Methods: Utilize performance testing tools to simulate user traffic and measure the impact of the changes.
- Validation: Compare the performance metrics before and after the optimization to validate the improvements.
- Example: Run performance tests to measure the impact of the optimized database query on page load times and transaction throughput.
- Feedback Mechanisms: Establish feedback mechanisms to gather insights from the testing and analysis.
- Iteration: Iterate on the optimization strategies based on the feedback, continuously improving the application’s performance.
- Example: If the optimized query still does not meet performance targets, gather further data, and refine the optimization strategy.
Detailed Description of an Illustration Depicting a Continuous Performance Improvement Cycle, Including Components and Their Interactions
The illustration depicts a cyclical process, emphasizing the iterative nature of continuous performance improvement. It visually represents the key components of the cycle and their interactions, demonstrating how data, analysis, action, and evaluation work together to achieve sustained performance optimization.The central element of the illustration is a circular diagram. The circle is divided into four quadrants, each representing a key stage in the continuous performance improvement cycle.
The quadrants are labeled as follows:* Monitoring: This quadrant, typically positioned at the top of the circle, shows a representation of a monitoring dashboard displaying various performance metrics. This dashboard shows metrics like CPU usage, memory utilization, response times, and error rates. A stream of data arrows flows into this quadrant from various sources, symbolizing the collection of performance data from application servers, databases, and network devices.* Analysis: This quadrant is positioned to the right of the Monitoring quadrant.
It depicts a stylized analytical process. A magnifying glass is superimposed on a graph, representing the analysis of performance data. This quadrant illustrates the process of identifying performance bottlenecks and areas for improvement. Lines and arrows connect the Monitoring quadrant to the Analysis quadrant, showing how data from the monitoring phase is fed into the analysis phase.* Action: Positioned at the bottom of the circle, this quadrant depicts an action phase, symbolizing the implementation of optimization strategies.
Icons representing code optimization, database tuning, and resource allocation adjustments are displayed. Arrows flow from the Analysis quadrant into the Action quadrant, illustrating how the identified issues lead to corrective actions.* Testing: Located to the left of the circle, this quadrant features a stylized testing environment, showcasing performance testing tools, such as load testing tools. Arrows flow from the Action quadrant to the Testing quadrant, indicating the testing of the implemented changes.The circular arrangement emphasizes the cyclical nature of the process.
Arrows are drawn between each quadrant to illustrate the flow of information and the continuous improvement loop. An arrow extends from the Testing quadrant back to the Monitoring quadrant, indicating that the results of the testing phase are used to inform the monitoring and analysis phases, starting the cycle again. This cyclical design represents the continuous feedback loop that drives ongoing performance improvement.
The entire cycle is enclosed within a larger, overarching circle, representing the continuous and ongoing nature of the performance improvement process.
Summary

In conclusion, effective application performance management after migration is not a one-time event but a continuous process. By adhering to the principles of thorough planning, strategic execution, and vigilant monitoring, organizations can successfully navigate the complexities of application migration. This guide provides a comprehensive roadmap, empowering IT professionals to optimize application performance, enhance user experience, and achieve their business objectives in the migrated environment.
The implementation of the discussed strategies will lead to increased agility, scalability, and overall IT efficiency.
Answers to Common Questions
What are the primary metrics to monitor post-migration?
Key metrics include response time, error rates, throughput (requests per second), resource utilization (CPU, memory, disk I/O), and database query performance. Monitoring these metrics provides a comprehensive view of application health and performance.
How often should performance tests be conducted after migration?
Performance testing should be conducted regularly, ideally as part of a continuous integration/continuous deployment (CI/CD) pipeline. This ensures that any code changes or infrastructure modifications do not negatively impact performance. The frequency depends on the rate of change and criticality of the application, but at least quarterly testing is recommended.
What are the common causes of performance degradation after migration?
Common causes include inefficient code, inadequate resource allocation, network latency, database performance issues, and changes in the underlying infrastructure. Careful analysis of these factors is crucial for identifying and resolving performance bottlenecks.
How can I ensure data integrity during and after the migration?
Data integrity can be ensured through thorough pre-migration data validation, using reliable data migration tools, performing post-migration data verification, and implementing data reconciliation processes. This minimizes the risk of data loss or corruption.
What is the impact of the chosen cloud provider on performance?
The choice of cloud provider significantly impacts performance. Factors such as the provider’s infrastructure, network capabilities, and available services influence application performance. Selecting a provider with optimized services and a geographically close data center can improve performance.